
Dynamic management views
Dynamic management views, first introduced with SQL Server 2005, provide information about server and database state. These views are useful for monitoring overall SQL Server health, identifying the root cause of SQL Server performance bottlenecks, and tuning SQL Server instance or database performance. The following is a list of dynamic management views available in SQL Server 20008R2, SQL Server 2012 and SQL Server 2014. You can use these views to obtain SQL Server memory usage information; for example, how much memory is available to a SQL Server instance or how well a SQL Server instance is using the available memory.
Sample:
SELECT * FROM sys.dm_os_sys_info;
Options:
- sys.dm_os_sys_info: Returns computer resources usage information.
- sys.dm_os_memory_cache_counters: Returns run-time information about the cache entries allocated, their use and the source of memory for the cache entries.
- sys.dm_os_memory_nodes: Returns information about the memory nodes.
- sys.dm_os_memory_cache_entries: Returns original and current cost of any cache entry.
- sys.dm_os_memory_cache_hash_tables: Returns a row for each active cache in the instance of SQL Server.
- sys.dm_os_memory_cache_clock_hands: Returns the status of each hand for a specific cache clock.
- sys.dm_os_memory_clerks: Returns detailed information about all memory clerks, which SQL Server is currently consuming.
- sys.dm_os_memory_objects: Returns information about the memory objects currently allocated by the instance of SQL Server.
- sys.dm_os_performance_counters: Returns SQL Server-specific performance counter information.
- sys.dm_os_ring_buffers: Returns detailed information about system health. The information returned is useful to troubleshoot memory pressure. This view is not currently supported by SQL Server 2014.
In addition to these views, SQL Server 2014 also has a set of dynamic management views specific to the new In-Memory OLTP engine. For more information, refer to the article “Memory-Optimized Table Dynamic Management Views (Transact-SQL)“ On Microsoft Developer Network.
DBCC MEMORYSTATUS command
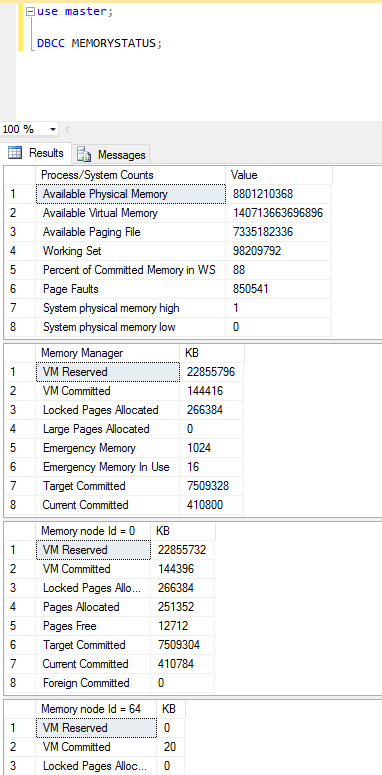
MEMORYSTATUS is an undocumented DBCC command that provides a snapshot of SQL Server’s current memory status. This memory usage information helps you quickly identify the root cause of the memory pressure on SQL Server and analyze how well SQL Server is using its allocated memory. Some of the information included in DBCC MEMORYSTATUS output is still not available through dynamic management views. That is why Microsoft Customer Support Services teams and experienced database administrators still rely on this undocumented DBCC command to quickly troubleshoot SQL Server memory consumption issues.
The DBCC MEMORYSTATUS command describes the distribution of 8k buffers among various components of SQL Server. It provides measurements that show how memory is currently allocated in SQL Server, information that is particularly useful if you’re troubleshooting issues related to SQL Server memory consumption. The command’s output (Figure 1) shows:
- Distribution of committed memory
- Size and makeup of the buffer pool
- Makeup of the procedure cache
- Distribution of Dynamic Memory Usage
- Distribution of various global memory usage
- Query memory grant information
- Concurrent query optimization status
- Memory management information, such as VM Reserved, VM Committed, AWE Allocated, Reserved Memory, Reserved Memory In Use
- How the SQL Server buffer cache is divided up, including buffer activity
- Information about Memory Manager, Clerks, Buffer Manager and a number of other SQL Server processes that consume SQL Server memory
Sample:
Extended Events
Extended Events, a highly scalable and lightweight performance monitoring system, uses very few system resources. You can use Extended Events system_health Session to monitor memory-related information such as memory broker, memory node out of memory errors, and so on. For more information about how to use it, refer to the article “Use the system_health Session” on Microsoft Developer’s Network.
sp_server_diagnostics
The system-stored procedure sp_server_diagnostics was first introduced with SQL Server 2012. It captures useful diagnostic data and health information about SQL Server to detect potential failures. For example, you can use this stored procedure to capture physical and virtual memory, buffer pools, pages, cache and other memory objects. For more information about this stored procedure, see its documentation at SQL Server Books Online.
SQL Server Profiler
SQL Server Profiler is a graphical user interface that captures SQL Server and Analysis Services activities. SQL Server Profiler captures the events as trace data, which you can save to a local file, network file or inside a SQL Server table. You can use SQL Server Profiler to capture memory-intensive queries and workloads running on a SQL Server instance. You can then optimize these queries to consume less memory.
Windows Performance Monitor
Windows Performance Monitor (Figure 2) is a Microsoft Management Console (MMC) snap-in that provides several useful counters that you can use to track SQL Server memory usage.
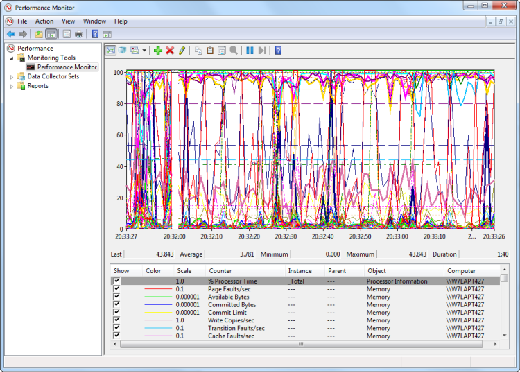
Using Windows Performance Monitor, watch these three general categories of memory counter:
- Potential low-memory conditions in system memory
- SQL Server memory usage, so you can determine whether or not SQL Server is causing the problem
- Potential low memory conditions related to the In-Memory OLTP engine
Figure 3 shows the most common memory-related performance counters you should monitor if you’re experiencing memory pressure on SQL Server.
| Object | Counter | Description |
| Memory | Available Bytes | Amount of memory available for processes; should be consistently higher than 5,000 KB. |
| Memory | Pages/sec | Should never climb consistently above 0. |
| Process | Page Faults/sec | A high value indicates excessive paging, which can result in both memory and the hard disk becoming performance bottlenecks. You must determine if the problem is being caused by SQL Server or by another process running on the system. |
| Process | Working Set | Monitor this value for each instance of SQL Server running on the system to determine the amount of system memory being used by SQL Server. This value should be greater than 5,000 KB at all times. |
| SQLServer: Buffer Manager | Buffer Cache Hit Ratio | For most applications, this value should be 90 or higher, indicating that most data requirements are being serviced from the cache. A lower value can indicate a memory bottleneck or a poorly designed application. |
| SQLServer: Buffer Manager | Total Pages | A low value here can indicate a need to install additional memory. Typically, a low number here is accompanied by a low Buffer Cache Hit Ratio. |
| SQLServer: Memory Manager | Total Server Memory (KB) | If this value is relatively high in comparison to total system memory, it’s a good indicator that you should install more memory. |
In addition to these counters, monitor Memory Grants Pending in the Performance Monitor object SQL Server Memory Manager Counters. This counter indicates the total number of processes per second waiting for a workspace memory grant. Typically, small OLTP transactions don’t require large memory grants. Memory grants with a value of greater than zero for a sustained period of time is a sign of memory pressure.